Quantcast
Channel: python Archives - Graph Database & Analytics
Viewing all 195 articles
Browse latest View live

This Week in Neo4j – 18 March 2017

$
0
0
This week in Neo4j - 18 March 2017
Welcome to This Week in Neo4j.

If you’ve got any ideas for things we should cover in future editions, I’m @markhneedham on Twitter or send an email to devrel@neo4j.com.

WordPress Recommendation Engine


Adam Cowley has been busy over the last couple of weeks building a Neo4j-based recommendation engine for WordPress.

This week in Neo4j - 18 March 2017

The WordPress graph

You can follow his work in a three-part blog series:

Social Network Analysis, Software Analytics and RDBMS-to-Graph


What’s happening on GitHub?


This week I decided to do some exploration of Neo4j projects on GitHub that haven’t necessarily surfaced on Twitter. I queried the Neo4j community graph to find the most recent Neo4j-based projects.

These were the most interesting ones I found:

Next Week


So what’s there to look forward to in the world of graphs next week?

Tweet of the Week


We’ll finish with my favourite tweet of the week by Tobias Zander. If you’re having fun playing with Neo4j, tweet with the #Neo4j hashtag and maybe you’ll feature in next week’s post.

Have a good weekend!

This Week in Neo4j – 25 March 2017

$
0
0
Explore everything that's happening in the Neo4j community for the week of 25 March 2017

Welcome to this week in Neo4j where we collect the most interesting things that have happened in the world of graph databases over the last 7 days.

If you’ve got something that you’d like to see featured in a future version let me know. I’m @markhneedham on Twitter or send an email to devrel@neo4j.com.


In last week’s online meetup Mesosphere’s Johannes Unterstein showed us how to get a Neo4j causal cluster up and running on DC/OS.


This was the culmination of several weeks’ effort where Johannes started with the Neo4j Docker image, figured out how to get it to play nicely with the Mesos ecosystem and created a Mesosphere Universe package so that users can easily create Neo4j clusters via the Marathon scheduler.

On top of this Johannes has been a part of the Neo4j community since 2013 and has organized several meetups as well as writing a Play Framework integration for Spring Data Neo4j.

On behalf of the Neo4j community I’d like to thank Johannes for all his efforts and I’m looking forward to your talk at GraphConnect Europe on 11th May 2017!

Using Graph Visualization to Explore Corruption in Egypt and FIFA


There were a couple of interesting posts showing how to use graph visualizations to explore two different types of corruption.

Lana Chan wrote What Do Big Data Paris and the Panama Papers Have In Common? In this post Lana shows how you can use the Tom Sawyer graph data visualization tool to explore the 2015 FIFA corruption scandal.

Explore everything that's happening in the Neo4j community for the week of 25 March 2017

Visualizing the Egypt corruption network

Noonpost, an interactive Arabic media website, explain how they used Linkurious for large-scale investigations in a project on Egypt’s corruption networks.

In the post, they explain how they were able to explore connections between the army and its affiliates across various influence networks including the health, food, and tourism sectors using a combination of Cypher queries and graph visualizations.

There’s lots of good stuff in both of these posts if you’re interested in data journalism.

If you’d like to do data journalism work using Neo4j but don’t know how, sign up for the Neo4j Data Journalism Accelerator Program and you’ll get the opportunity to work with engineers from Neo4j’s Developer Relations team to get your analysis up and running.

Visual Graph Modeling and Importing


Michael Hunger created a video showing how to sketch graph models and load them into Neo4j using Alistair Jonesarrows tool.


Will Lyon presented a webinar late last week where he showed how to model and import real-world datasets using Neo4j.

Will shows how to import data from Yelp using several different approaches:

    • apoc.load.json – a procedure from the APOC library that can import JSON data directly.
    • LOAD CSV – a Cypher command for importing CSV files. Works well up to ~10 million rows.
    • neo4j-import – a tool for importing large initial datasets.

Will also talks about Neo4j’s user-defined procedures and functions, and if you’re interested in creating your own ones we’ve created a couple of new pages on the Neo4j developer site to help you get started:

Emil in Forbes, Hiking Recommendations, Malware Clustering, and DC/OS


On the Podcast


This week Rik interviewed Alistair Jones about the Causal Clustering feature released in Neo4j 3.1 back in December.

They go through the history of clustering in Neo4j from the use of Zookeeper in the 1.8 series up to the current day where we’ve implemented a version of Diego Ongaro‘s Raft consensus protocol.

If you want to learn more, there’s also a video of Alistair presenting on this topic.

Next Week


So what’s there to look forward to in the world of graphs next week?

Tweet of the Week


My favorite tweet this week was by Jose Ramón Cajide who’s been analyzing Twitter networks using Neo4j in RStudio:

If you want to graph your own Twitter network you can try out the Neo4j Twitter Sandbox. Don’t forget to tweet your graph using the #Neo4j hashtag if you give it a try.

Enjoy your weekend, it’s finally spring – hoorah!

Cheers, Mark

Public Service Announcement: Neo4j Drivers 1.2 Release

$
0
0
Learn all about the latest 1.2 release of the Neo4j drivers

We are happy to announce that all our officially supported Bolt drivers are now available as versions 1.2. With this release, we massively improved the way you write code to work with a cluster, introducing reusable “transaction functions” and built-in retry functionality.

For some new capabilities we added new APIs. Here you can find detailed documentation and the driver repositories.

New Capabilities in all Neo4j Drivers


Drivers now handle cluster server failures and role changes automatically, allowing the application to treat the cluster as a single black box providing read and write service. This simplifies the programming model massively. You don’t have to care about cluster state or retrying operations after its change.

    • A Bolt+routing URI represents a network address
    • Automatic DNS “Round Robin” resolution can yield multiple hosts → addresses
    • A load balancer (e.g., AWS ELB) can route to multiple hosts → addresses
    • These are the routing bootstrap addresses: they should be configured to be probable core servers
    • Read Replicas cannot provide routing tables
    • When the driver is initialized, it goes to one of the bootstrap addresses to get a routing table

Neo4j drivers requests routing table
Neo4j drivers cluster returns routing table
Neo4j drivers routes client request
Neo4j drivers refreshes routing table


The Neo4j driver will switch traffic to an appropriate read or write connection depending on the transaction access mode. The read/write transaction access mode is a familiar SQL/ODBC/JDBC pattern of use.

We added new methods Session.read_transaction and Session.write_transaction to allow the execution of reusable units of work. You simply pass in a transaction function to the method. To allow re-execution of failed operations, duration for retries is configurable via max_retry_time in the Neo4j driver configuration (the default is 30s).

Here is an example on how you would use this capability:

Python Example


from neo4j.v1 import GraphDatabase


driver = GraphDatabase.driver("bolt+routing://server:7687",
                              auth=("neo4j", "password"))


def add_friends(tx, name, friend_name):
    tx.run("MERGE (p:Person {name: $name}) "
           "MERGE (f:Person {name: $friend_name}) "
           "MERGE (p)-[:KNOWS]-(f)",
           name=name, friend_name=friend_name)


def print_friends(tx, name):
    for record in tx.run(
          "MATCH (a:Person)-[:KNOWS]->(friend) WHERE a.name = $name "
          "RETURN friend.name ORDER BY friend.name", name=name):
        print(record["friend.name"])


with driver.session() as session:
    session.write_transaction(
      lambda tx:
        tx.run("create constraint on (p:Person) assert p.name is unique"))
    session.write_transaction(add_friends, "Arthur", "Guinevere")
    session.write_transaction(add_friends, "Arthur", "Lancelot")
    session.write_transaction(add_friends, "Arthur", "Merlin")
    session.read_transaction(print_friends, "Arthur")

Java Example


You can find the full code in this example project.

public class Person{
    private final static String COUNT_PEOPLE =
         ("MATCH (a:Person) RETURN count(a)");

    // callback method
    public static long count(Transaction tx){
        StatementResult result = tx.run(COUNT_PEOPLE);
        return result.single().get(0).asLong();
    }
    ...
}


public class SocialNetwork{
    public long countUsers() {
        try (Session session = driver.session()){
            return session.readTransaction(Person::count);
        }
    }

    public long addUser(Person user) {
        System.out.println(format("Adding user %s", user));
        try (Session session = driver.session(){
            return session.writeTransaction(user::save);
        }
    }
}

We decoupled the Session from a single underlying connection; a Session can now be defined as a causally linked sequence of transactional units of work.

You don’t need to manage bookmarks for causal consistency manually any longer. Bookmarks are now automatically passed between transactions within a routing session. This makes causal consistency the default interaction mode with the database cluster.

Auto-commit transactions (Session.run) will now run partially synchronous to the network (RUN and PULL_ALL will be sent to the server, the RUN response will be immediately received); this allows exceptions to be raised at a more logical point in the application

Updates in Some of the Neo4j Drivers


The Python language driver now includes a compiled C module included for improved performance on supported platforms. Please let us know if this works for you.

If the provided hostname resolves to multiple IP addresses most of the drivers (except .NET) can handle this now.

As always, we’d love your feedback, so please try out the new Neo4j driver releases and raise feature or bug requests on the driver repositories. Please let us also know what you think about the new APIs and if there are ways to improve them.

If you need quick help, please join neo4j.com/slack and ask in the #drivers or the appropriate #neo4j-<language> channel. Otherwise you can also ask on Stack Overflow. Please tag your Stack Overflow questions with [neo4j-<language>-driver]

Enjoy the new Neo4j drivers,

Nigel Small, for the Neo4j Drivers Team

This Week in Neo4j – 22 April 2017

$
0
0

Welcome to this week in Neo4j where we round up what’s been happening in the world of graph databases in the last 7 days.


This Week in Neo4j - 22 April - Dmitry Vrublevsky from Neueda Labs

Dmitry Vrublevsky from Neueda Labs

This week’s featured community member is Dmitry Vrublevsky who works for Neueda Labs and has been very active in Neo4j’s community for quite some time.

He started helping people on StackOverflow and Slack and then started the development of the Neo4j plugin for all the Jetbrains IDEs. That work has evolved into a full featured database tool, which was recently featured on this blog.

Dmitry also spoke at the openCypher implementers meeting in February and will be at GraphConnect in London. He and his team is currently helping us to add some cool features to the Neo4j Browser.

Neo4j at the Galway-Mayo Institute of Technology


Multiple students from GMIT have been using Neo4j as part of their graph theory course and have been building a graph of the university timetable.

I wish I’d got to use Neo4j at university so I’m very jealous – it was Oracle all the way where I studied!

APOC, Call Data Records, GORM, Twitter Clone


Online Meetup: Building the Wikipedia Knowledge Graph


In this week’s Neo4j online meetup, Dr Jesús Barrasa and I showed how to load the Wikipedia Knowledge Graph into Neo4j and write queries against it.

We’ve been hosting meetups almost every week for the last couple of months so if you want to catch up on earlier episodes you can find all of them on the Neo4j Online Meetup playlist.

From The Knowledge Base


We also have a really cool discussion of ways to limit MATCHes in subqueries by Andrew Bowman, our featured community member in the 25 February 2017 edition of TWIN4j.

On GitHub: Mahout, Holocaust Research, Kafka Connector


There’s been an incredible amount of activity on GitHub this week. These were the most interesting projects that I came across.

    • UserLine automates the process of creating logon relations from MS Windows Security Events by showing a graphical realtion among users domains, source and destination logons as well as session duration.
    • Nigel Small created Memgraph – a Python library that provides a Neo4j-compatible in-memory graph store.
    • There were some updates to the European Holocaust Research Infrastructure project, which provides a business layer and JAX-RS resource classes for managing holocaust data.
    • Erick Peirson created cidoc-crm-neo4j which is a meta-implementation of the CIDOC Conceptual Reference Model (CRM). The CIDOC CRM provides definitions and formal structure for describing the implicit and explicit concepts and relationships used in cultural heritage documentation. The project uses Python’s neomodel to interact with a Neo4j database
    • gbrodar created pcap4j – a repository of scripts for analysing the output of the Unix pcap tool.
    • Mark Wood created neo4j-mahout which wraps calls to Mahout functions in Neo4j user defined functions. I played around with Mahout a couple of years ago so I’m quite excited to try combine it with Neo4j using this tool.
    • JunfengDuan created kafka-neo4j-connector, which transfers data from Kafka to Neo4j.

Neo4j Jobs


I’ve not listed jobs in TWIN4j before but I came across an interesting one posted by Musimap, a B2B cognitive music intelligence company in Brussels. They’re hiring a Full-Stack Web Developer with Neo4j and Python experience so if that sounds like your type of thing it might be worth applying.

If you have any jobs that you’d like me to feature in future versions, drop me a tweet @markhneedham.

Next Week


What’s happening next week in the world of graph databases?

Tweet of the Week


My favorite tweet this week was by Felix Victor Münch:

Don’t forget to retweet Felix’s post if you liked it as well!

That’s all for this week. Have a great weekend.

Cheers, Mark

This Week in Neo4j – 29 April 2017

$
0
0
This Week in Neo4j - 29 April 2017

Welcome to this week in Neo4j where we round up what’s been happening in the world of graph databases in the last 7 days.

But before we begin, a quick announcement from us, the Neo4j Developer Relations team.

Developer Zone at GraphConnect Europe 2017


To provide the best developer experience at our GraphConnect conference in London, on May 11th 2017, we will open a dedicated Developer Zone.

We will all be joined by Neo4j engineers, eager to answer your questions and talk about cool stuff you can do with Neo4j.

So if you can make it to London for GraphConnect, don’t miss out for the best experience of the show – the Developer Zone. You can register with the DEVZONE30 discount for 30% off, or send an email to devrel@neo4j.com to get one of the few free or 50% off tickets.


This Week in Neo4j - 29 April 2017

This week’s featured community member – Michael Moussa

Michael has been active for quite a while in the Neo4j community, presenting introductions to Neo4j at multiple PHP conferences. Last week he presented at the Lone Star PHP Conference in Dallas, TX.

He’s also contributed to PHP related projects in the Neo4j community and answered questions in our open channels.

Last few days of APOC Awareness Month


We’re in the last days of the APOC Awareness Month so if you haven’t published your article, you have until Monday evening (May 1st might be a good day off to work on this).

Tomaz Bratanic continued his APOC algorithm series and wrote this time about similarities, cluster finding and visualizing them with virtual nodes and relationships. A very interesting read!

Python, PyData, Flask, NeoModel, and Neo4j


Nigel Small, author of py2neo and tech lead of the drivers team visited Amsterdam a couple of weeks ago to present “A Pythonic Tour of Neo4j and the Cypher Query Language” at the PyData conference.

Mostafa Moradian published gRest, a quickstart repository to build applications with Python, Flask, and NeoModel – a Django-like OGM for Neo4j.

The GraphConnect schedule is a graph


GraphConnect Schedule Graph

The GraphConnect Europe 2017 Schedule

Besides interviewing our community for the Graphistania Podcast and creating Graph-Karaokes, Rik van Bruggen also loves to recreate event schedules in Neo4j, for easy querying and recommendations.

GraphConnect is no exception and you can now view the schedule as a graph.

Wikipedia Knowledge Graph, GraphQL, Causal Clustering


    • As a follow up to last week’s online meetup my colleague Jesús Barrasa published a blog post explaining how to create the Wikipedia Knowledge Graph in Neo4j. He loads pages and categories and enriches them by querying dbpedia. You can follow along by running the Neo4j-Browser Guide Jesús created in the blank Neo4j Sandbox.
    • Rik also published parts 2 , 3, and 4 of his series of explaining common questions about Neo4j. You get very detailed answers on the questions of scale, usage of Lucene, Solr and transactions and the Gremlin support of Neo4j.
    • If you love to extend Neo4j you will like this article by Igor Borojevic, who shows as part of the security series with Neo4j how to build a custom security plugin, to chose your own way of doing Authentication and authorization
    • Chris Skardon explains step by step how to manually set up a causal cluster with Neo4 3.1.3 on Microsoft Azure. Enjoy his funny observations and comments in his blog post: So you want to go Causal Neo4j in Azure? Sure we can do that
    • Magnus Wallberg wrote up the PhUSE conference where he attended a workshop led by Tim Williams comparing RDF and graphs.
    • If you’re looking for a job where you can work with Neo4j full time, Matt Andrews at the Financial Times is hiring:

The Mattermark GraphQL API Graph


GraphQL has been on our minds, lately. So, when the Mattermark GraphQL API became available, Will Lyon looked into it and created this insightful blog post on analysing local startup ecosystems based on their data.

He uses ApolloClient to access the API and turn the data of startups based in his home state of Montana into a graph in Neo4j.

Will then goes on to use Cypher queries to answer questions such as:

    • What are the companies in Montana that are raising venture capital?
    • Who are the founders?
    • Who is funding them and what industries are they in?_

Online Meetup: Learning Chinese with Neo4j


In this week’s online meetup Fernando Izquierdo showed us how to learn Chinese using Neo4j.

Even if you’ve got no interest in learning Chinese this is still worth watching because it’s such an innovative use of graphs.

From The Knowledge Base


This week from the Neo4j Knowledge Base:

On GitHub: Rust, Spring Data Neo4j, The Bible


Here are some of the most interesting projects I found on my GitHub travels:

    • If you like to work in Rust, this Crate can help you to access Neo4j natively. It uses Cypher via the HTTP protocol and is well documented in the readme. It even offers a Macro based approach for less clutter in your code.
    • Marco Falcier created a quick Spring Data Neo4j example project for managing forests of trees, that gives you a good starting point. It runs on a temporary in-memory database and comes with an Angular frontend and provides Mockito based tests.
    • The MetaV viz.bible is an online and mobile site publishing detailed connections between bible verses and provides a lot of insights and charts. Olin Blodgett took the CSV data which is available under a CC license and transforms it into a graph in Neo4j. You can also see the underlying data model and some example queries. Would be interesting to build an app on top of that graph data which could augment viz.bible with deeper insights based on graph queries and analytics.
    • If you are into life-sciences research and want to work with Snomed data in Neo4j, Pradeep created a Docker based workflow using the official containers for Neo4j and Snomed and a Groovy script to load the data into a graph.

Tweet of the Week


My favorite tweet this week was by Christos Delivorias:

That’s all for this week. Have a great weekend.

Cheers, Michael & Mark

An Introduction & Tutorial for Structr 2.1

$
0
0
Learn more about Structr 2.1 in this introduction and tutorial walking you through the new features
In one of our previous blog posts, we promised to write more about new features of our upcoming release of Structr, version 2.1, so here we are.

New Tutorial


But before we dive into the details, we’d like to to announce the first tutorial that our friends over at The SilverLogic created and which will be part of a series of example projects we’ll publish over the next few months. The detailed tutorial on how to create a Structr app shows many of the new features listed in this post. If you follow the tutorial, you will be able to create a simple blogging app within a couple of hours.

You can find the full tutorial on the Structr blog at https://structr.org/blog/blog-app-tutorial.

Learn more about Structr 2.1 in this introduction and tutorial walking you through the new features


And now back to the features.

New Features


One of the most requested features among many other improvements and bugfixes is finally here and aims at developer productivity: We added a new deployment tool that allows you to export a complete Structr application in form of a collection of HTML and JSON files so that you can store it in any version control system (VCS).

We found a way to serialize and export all information which makes up a Structr app and is stored in Neo4j at runtime, to a filesystem structure. This allows you to use your favorite Integrated Development Environment (IDE) and diff and merge tools to make and track changes. In addition, the deployment tool (export/import) can even be used remotely over HTTP(S) so you don’t need a console login on the server to update your Structr instance.

Another new feature which makes operating Structr easier is the new web-based configuration tool: No need to manually edit the structr.conf file anymore!

The config tool UI in Structr 2.1


The most anticipated feature of the new configuration interface is that you can now start and stop services individually while Structr is running. That means you can disconnect Structr from one Neo4j database and connect it to another, all without stopping the JVM instance, or you can enable and disable debugging and logging flags at runtime, which will greatly improve productivity.

Apart from that, the upcoming 2.1 release contains lots of new features to boost productivity: There’s a new administration console (press Ctrl-Shift-C to activate) for quick and easy scripting tasks, maintenance operations or monitoring log files, etc. We also improved the internal JavaScript scripting bridge and built a foundation which allows us to add support for more scripting languages like Ruby, PHP, Python or R.

Some More Improvements


A few other things we improved:
    • The test coverage has been improved and the tests are running much faster now due to better reuse of Neo4j instances.
    • A couple of new widgets to massively speed up app development
    • Improved schema layout and schema editor enhancements
    • Favourites: Define editable texts like script files or content elements as favourites and access them quickly via a keyboard shortcut (Ctrl-Alt-F)

Developer Support Program


Due to the rapidly growing demand for documentation, training materials and project support, we created a new program called the Developer Support Program which covers the most requested support services in an attractive package. We’ll announce more details soon.

GraphConnect Europe


Last but not least, Structr is once again happy to be a Gold Sponsor of the upcoming GraphConnect Europe happening in London on 11 May 2017. Save 30% on all tickets with the promo code STRUCTR30.

See you in London!


Join us at the Europe’s premier graph technology event: Get your ticket to GraphConnect Europe and we’ll see you on 11th May 2017 at the QEII Centre in downtown London!

Get My Ticket

This Week in Neo4j – 6 May 2017

$
0
0

Welcome to this week in Neo4j where we round up what’s been happening in the world of graph databases in the last 7 days.


This week’s featured community member is Alessio De Angelis, an IT consultant at Whitehall Reply for projects held by SOGEI, the Information and Communication Technology company linked to the Economics and Finance Ministry in Italy.

This week’s featured community member: Alessio De Angelis

Alessio first came onto the Neo4j scene while taking part in a GraphGist competition a few years ago and created an entry showing Santa’s shortest weighted path around the world.

Querying the Neo4j TrumpWorld Graph with Amazon Alexa


The coolest Neo4j project of the week award goes to Christophe Willemsen, our featured community member on 2 April 2017.

Christophe has created a tool that executes Cypher queries in response to commands issue to his Amazon Alexa.

Rare diseases research, APOC spatial, Twitter Clone


Rare diseases research

Rare diseases research using graphs and Linkurious

Online Meetup: Planning your next hike with Neo4j


In this week’s online meetup Amanda Schaffer showed us how to plan hikes using Neo4j.

There’s lots of Cypher queries and a hiking recommendation engine, so if that’s your thing give it a watch.

From The Knowledge Base


On the podcast: Andrew Bowman


In his latest podcast interview Rik van Bruggen interviews our newest Neo4j employee, Andrew Bowman. You’ll remember that Andrew was our very first featured community member on 25 February 2017.

Rik and Andrew talk about Andrew’s contributions to the community and Andrew’s introduction to Neo4j while building social graphs for Athena Health.

On GitHub: Graph isomorphisms, visualization, natural language processing


There’s a variety of different projects on my GitHub travels this week.

Next Week


It’s GraphConnect Europe 2017 week so the European graph community will be at the QE2 in London on Thursday 11th May 2017.

The venue for GraphConnect Europe 2017

The QE2 in London, the venue for GraphConnect Europe 2017

If you would like to be in with a chance of winning a last minute ticket don’t forget to register for our online preview meetup on Monday 8th May 2017 at 11am UK time.

We’ll be joined by a few of the speakers who’ll give a sneak peek of their talks as well as talk about what they love about GraphConnect.

Hope to see you there!

Tweet of the Week


I’m going to cheat again and have two favourite tweets of the week.

First up is Chris Leishman sharing his favourite font for writing Cypher queries:

And there was also a great tweet by Caitlin McDonald:

That’s all for this week. Have a great weekend and I’ll hopefully see some of you next week at GraphConnect.

Cheers, Mark

This Week in Neo4j – 3 June 2017

$
0
0

Welcome to this week in Neo4j where we round up what’s been happening in the world of graph databases in the last 7 days.


This week’s featured community member is Niklas Saers, iOS Lead at Unwire and the co-maintainer of Theo – the Neo4j Swift driver with Cory Wiles.

Niklas Saers – This week’s featured community member

Niklas first came across Neo4j in a workshop hosted by Dr Jim Webber and Ian Robinson back in 2011 and had used it for several prototypes before getting involved with the port of Theo to Swift 3.0 in December 2016.

At that point Theo still used Neo4j’s HTTP API so Niklas got to work porting it to use the Bolt protocol. In the process he built Bolt-swift, as well as Packstream-Swift.

Next up for Niklas is integrating Theo with Fluent, an ORM for the Server Side Swift framework Vapor.

On behalf of the Neo4j and Swift communities, thanks for all your hard work Niklas!

WikiMap: Analysing Wikipedia in Neo4j


Raj Shrimali has written a series of articles around importing Wikipedia into Neo4j.

    • Genesis in which Raj explains the import process and loads in a subset of the full dataset.
    • Pivot in which Raj experiments with using different number of threads to import the data.
    • Optimization where the attempts to speed up the import process continue.
    • Processing where Raj runs a mini retrospective on the import process so far.

The code for Raj’s project is available in the wiki-analysis repository on GitHub.

Neo4j <3 Preact


The release of Neo4j 3.2 at GraphConnect Europe 2017 saw the release of a brand new version of the Neo4j browser.

The browser was completely rewritten using Preact, the fast 3kB alternative to the popular React library, and Neo4j are now a proud sponsor of the project.

On behalf of all users of the Neo4j browser, thank you Preact!

Getting started with Neo4j


This was a week where several people wrote about their experiences getting started with graph databases.

Friday is release day


This week saw the release of 4 different versions of Neo4j.


    • 3.3.0-alpha01 – the first milestone release in the 3.3 series contains support for multiple bookmarks in the Bolt server, bug fixes for the Neo4j browser, and support for USING INDEX for OR expressions in Cypher.
    • 3.2.1 contains support for multiple bookmarks in the Bolt server, bug fixes for the Neo4j browser, as well as a few Hazelcast related usability improvements.
    • 3.1.5 contains some procedure bug fixes and improved batching in the import tool.
    • 2.3.11 saw a few minor bug fixes.

If you give any of these releases a try let us know how you get on by sending an email to devrel@neo4j.com

Python for IoT, PHP crawler, relational db analysis


    • Carl Turechek created Reckless-Recluse – a powerful PHP crawler designed to dig up site problems.
    • Nigel Small created n4 – a Cypher console for Neo4j. n4 aims to consolidate the old py2neo command line tooling in a new console application which takes inspiration from Nicole White‘s cycli tool.
    • Matt Lewis created thingernet-graph – a Python script that creates a Neo4j graph showing how a set of Internet of Things (IoT) devices are connected.
    • Rubin Simons created silver – a tool for loading relational/dependency information from relational database systems into Neo4j for analysis and visualization. At the moment it works with Oracle and next up are PostgreSQL, MySQL, and DB2.

From The Knowledge Base


This week from the Neo4j Knowledge Base we have an article showing how to reset query cardinality in Cypher queries to address the ‘too much WIP’ issue that you can sometimes run into.

On the Podcast: Steven Baker


On the Graphistania podcast this week we have an interview with Steven Baker, Neo4j Drivers Engineer and the creator of the Ruby behavior-driven development (BDD) framework RSpec.

Rik and Steven talk about the history of BDD, Steven’s work building out drivers test infrastructure, living in Sweden, and more.

If you enjoy the podcast don’t forget to add the RSS feed to your podcast software or add it on iTunes.

Next Week


What’s happening next week in the world of graph databases?

Tweet of the Week


My favourite tweet this week was by Jamie Gaskins:

Don’t forget to RT if you liked it too.

That’s all for this week. Have a great weekend!

Cheers, Mark


Integrating All of Biology into a Public Neo4j Database

$
0
0
Watch Daniel Himmelstein's presentation on the heterogeneous biomedical network Hetionet
Editor’s Note: This presentation was given by Daniel Himmelstein at GraphConnect San Francisco in October 2016.

Summary


Himmelstein started his PhD research with the question: How do you teach a computer biology? He found the answer in a heterogenous network (a.k.a., “HetNet”), which turned out to be another term for a labelled property graph.

After an attempt to create his own Python package for querying HetNets, Himmelstein turned to Neo4j. By importing open source drug and genetic information, he has developed a graph with more than 2 million relationships that can be mined for drug repurposing – in other words, finding new treatment uses for drugs that are already on the market – via a growing dataset of matching compound-disease pairs.

For each of the current 200,000 compound-disease pairs, his project computes the prevalence of many different types of paths and then uses a machine learning classifier to identify the patterns of the network, or the paths, that are predictive of treatment or efficacy. As an example, Himmelstein shows you how his HetNet project helped identify bupropion as a drug that not only treats depression but also nicotine dependence.

Integrating all of Biology into a Public Neo4j Database


What we’re going to be talking about today is developing a heterogenous network for biological data so that we can discover new treatment uses for existing drugs:


How to Teach a Computer Biology


I started my PhD with the question: How do you teach a computer biology? What’s the best way to encode biological and medical knowledge into a computer in a way that the computer can operate and understand that information?

It quickly became clear that for both me and the computer, the most intuitive way would be through networks with multiple nodes or relationship types. But we had a problem: there were at least 26 different names for this type of network, such as multilayer network, multiplex network, overlay, composite, multilevel and heterogeneous network.

The studies we built off of most often used the term “heterogeneous information network.” But we thought the name was too long — and that no one would ever want to work in a field with that name.

So what do you do when you have 26 different terms that you don’t like? You make it 27.

We call our data structure a HetNet, which is short for heterogeneous network. The Neo4j community often refers to the labelled property graph model, and this is really the same thing. The difference is that HetNet focuses on the fact that every node and relationship has a type. And that’s what we wanted to bring to biomedical study that hadn’t been there previously.

HetNet: Choosing the Right Software


The next question was: What is the best software for storing and querying these HetNets?

Hetio was a piece of a Python package that I created, and over the years, it has accumulated 86 commits, has five GitHub stars and two forks. And I don’t like doing work, so when I learned that the Neo4j project offered the same functionality and more — with 42,000 commits over 3,000 stars and one 1,000 forks — I realized it was a thriving community I wanted to be a part of.

The next step was putting biology into Neo4j. We did that last July by releasing Hetionet Version 1.0, which is a HetNet of biology designed for drug repurposing — which is finding new uses for existing drugs. It’s often much cheaper and safer to find a new use for drugs that we already know are safe for humans, rather than designing a new compound from scratch.

This network has 50,000 nodes of 11 types — which we would call labels in Neo4j. Between these 50,000 nodes are 2.25 million relationships of 24 types.

To build this network, we integrated knowledge from 29 public resources, which integrated information from millions of studies. This means that a lot of our relationships will point back to the studies that the information came from. A lot of this information was extracted through manual curation, by third parties or text mining, or big genomic experiments or sequencing.

The hardest part was the licensing of all this publicly available data. A lot of people don’t realize that just because you have access to a piece of data online doesn’t mean you can use it, reproduce it or give it away however you want. Nature News wrote an article on this called, “Legal maze threatens to slow data science.”

If you’re releasing data online and you want people to be able to use it, make sure to put an open license that allows them to do so.

The Hetionet Metagraph


Below is our metagraph, which also goes by the name data model or schema:

Hetionet metagraph graphconnect

You can see the 11 different types of nodes and the 24 types of relationships here. Something important to note are the compounds and the diseases, and we know currently what compounds are known to treat what diseases.

We also included information about genes. For example, when a compound binds a gene, that refers to when the compound physically attaches to the protein which is encoded by that gene.

Another example is when a gene associates with the disease. This means that genetic variation in that gene influences your susceptibility to a certain disease, and there have been big studies called GWA studies — thousands of them — which have given us a rich catalog of these relationships between genes and diseases. The network also contains many other types of relationships.

It’s hard to visualize a HetNet, but below is our best attempt:

Watch Daniel Himmelstein's presentation on the heterogeneous biomedical network Hetionet


Each node is a tiny little dot and laid out either in a circle, or in a line, for the compounds and diseases. Each relationship is a curved line colored by its type. This is a bird’s eye view of one way of looking at a HetNet, which should help you understand what we’re dealing with.

Without a good graph algorithm, it would be very hard to tell anything about it. But with Cypher, we can do intelligent local search and machine learning to do cool things.

We host this network in a public Neo4j instance, and as far as I know we are the only people hosting a completely public Neo4j instance. We use a customized Docker image to deploy it on a DigitalOcean Droplet, and it has SSL from letsencrypt. It’s a read-only mode with a query execution timeout, and it has a custom display node visual style and custom Neo4j Browser guides to point our users to cool things.

Below is a demo of the guide we’ve created:


The Rephetio Project


We tried to apply this to drug repurposing in a project we code-named Rephetio.

Hetionet Version 1.0 contains about 1,500 connected compounds and 136 connected diseases, which between them provides over 200,000 compound-disease pairs. Each compound-disease pair is a potential treatment, and we want to know the probability of whether or not it has drug efficacy. We do currently know about 755 treatments, and these are for diseases your doctor would give you a medication for.

The way we decided to understand the relationship between a compound and a disease is to look along certain types of paths that we call metapaths. If you look for the different types of paths that can connect a compound to disease with a length of four or less, there are 1,206 of them based on our metagraph. Even though this is a lot of computation, we were able to run it.

So, for each of these 200,000 compound-disease pairs, we compute the prevalence of a bunch of different types of paths and then use a machine learning classifier to identify the patterns of the network, or the paths, that are predictive of treatment or efficacy.

Through that, we’re able to predict the probability of treatment for all 200,000 compound-diseased pairs. These predictions are online, and you are free to use them however you’d like.

What we found very cool is that those 755 known treatments were ranked very highly by our approach, as you can see by how this violin plot is weighted in the high percentiles:

Hetio predictions for new drug applications succeeds


Even more interesting potentially is that we were able to highly prioritize drugs currently in clinical trials based on our predictions.

An Example: Bupropion


Let’s get to a specific example with bupropion, along with our question: Does it treat nicotine dependence?

It was first approved for depression in 1985, but due to the serendipitous observation that people taking the medication for depression were also less likely to smoke, it was approved in 1997 for smoking cessation. So we asked, “Can we predict this using our network, and what is the basis of that prediction?”

We happened to score this treatment highly: It was in the 99.5th percentile for nicotine dependence, a probability 2.5-fold greater than we’d expect.

Some of the paths that our approach predicts to be meaningful are that bupropion causes terminal insomnia as a side effect, which is also caused by Varenicline — another approved treatment for nicotine dependence.

Similarities between genes and symptoms point to new drug uses


Sometimes when two drugs share a specific side effect, it’s because they have a similar mechanism of action and that could be harnessed for a potential future treatment. Bupropion binds to this CHRNA3 gene which is also bound by varenicline – more evidence that these two drugs could be doing something similar.

Furthermore, there’s an association between the gene and nicotine dependence, which gives a good indication that that gene has some involvement in the disease.

And then, we have many pathways which this gene participates in:

Shared gene pathways point to more shared genes and diseases


The pathways are the orange circles that other nicotine dependence associated genes participate in, so these are the ten paths that our approach finds most supportive of this prediction.

And you can see this in the Neo4j Browser in an interactive way — watch the demo below:


A lot of special thanks to everyone who helped me with this project, especially all the people at Neo4j who helped me on Stack Overflow and GitHub. It’s really been a fantastic community to be part of, and there are a lot of resources below:

Special thanks from the Hetio community


Inspired by Daniel’s talk? Click below to register for GraphConnect New York on October 23-24, 2017 at Pier 36 in New York City – and connect with leading graph experts from around the globe.

Register for GraphConnect

This Week in Neo4j – 15 July 2017

$
0
0
Jonathan Freeman - This week's featured community member

Welcome to this week in Neo4j where we round up what’s been happening in the world of graph databases in the last 7 days.


This week’s featured community member is Jonathan Freeman, Senior Software Engineer at Spantree Technology.

Jonathan Freeman - This Week's Featured Community Member

Jonathan Freeman – This Week’s Featured Community Member

Jonathan has been a member of the Neo4j community for a number of years now and presented on Hadoop and Graph Databases at one of the very early GraphConnect conferences in New York in 2013

Jonathan has also trained Neo4j classes and been a great advocate for Neo4j wherever he’s worked.

More recently Jonathan has been organising the Neo4j Chicago meetup, and this week presented 400 trash bags of grocery receipts + Neo4j in which he analysed Instacart’s open dataset using Neo4j.

On behalf of the Neo4j community, thanks to Jonathan for all your work!

Natural Language Understanding with Neo4j


In this week’s online meetup Dan Kondratyuk showed us Graph NLU – a project he built to understand natural language dialogue in an interactive setting by representing memory of previous dialogue states using a persistent graph


You can also find the code in the graph-nlu repository on GitHub.

Phil Gooch presented Graph databases and text analytics at the London Text Analytics meetup. The code from Phil’s talk is available in the neo4j-nlp GitHub repository.

Game of Thrones, GraphQL, Cuckoo Filters, Mulesoft


From The Knowledge Base


This week from the Neo4j Knowledge Base we have an article showing how to easily validate network port connectivity on your Neo4j clusters.

Next Week


On Wednesday, July 19, 2017 Nigel Small, Tech Lead of the Neo4j Drivers Team, will be presenting An introduction to Neo4j Bolt Drivers as part of the Neo4j online meetup.

Don’t forget to join us on YouTube for that one.

Tweet of the Week


My favourite tweet this week was by Vinicius Feitosa from the Euro Python conference:

Don’t forget to RT if you liked it too.

That’s all for this week. Have a great weekend!

Cheers, Mark

Cypher: Write Fast and Furious

$
0
0
Watch Christophe Willemsen’s presentation on how to get the fastest Cypher queries possible
Editor’s Note: This presentation was given by Christophe Willemsen at GraphConnect San Francisco in October 2016.

Presentation Summary


In this presentation, Christophe Willemsen covers a variety of do-and-don’t tips to help your Cypher queries run faster than ever in Neo4j.

First, always use the official up-to-date Bolt drivers. Next, leave out object mappers as they produce too much overhead and are not made for batch imports.

Then, Willemsen advises you to use query parameters since using parameters allows Neo4j to cache the query plan and reuse it next time. Also, you should always reuse identifiers within queries because using incremental identifiers prevents the query plan from being cached, so Cypher will think it’s a new query every time.

Willemsen’s next tip is to split long Cypher queries into smaller, more optimized queries for ease of profiling and debugging. In addition, he advises you to check your schema indexes. By creating a constraint in your Cypher query, you will automatically create a schema index in the database.

The final two tips are to batch your writes using Cypher’s UNWIND feature for better performance, and finally, to beware of query replanning, which can plague more seasoned Cypher users with constantly changing statistics that can slow down queries and introduce higher rates of garbage collection.

Full Presentation: Cypher: Write Fast and Furious


What we’re going to be talking about today is how to make the most out of the Cypher graph query language:


We will go over a few things not to do and will talk about ways to improve the performance of your Cypher queries.

Use Up-to-Date, Official Neo4j Drivers


The first thing to keep in mind is that you need to use an up-to-date, Neo4j-official Bolt driver.

The four official Neo4j drivers are for Python, Java, JavaScript and .NET. At GraphAware, we also maintain the PHP driver, which is in compliance with the Neo4j technological compliance kit.

Forget Object Mappers


The next thing to do is completely forget object mappers.

You can find Neo4j-ogm in Java, Python, etc. but when you want to write fast and you need to write personalized queries for your writes and domain, the Object-Graph Mapper (OGM) adds a lot of overhead, is not made for batch imports and keeps you from going fast.

So if you want to write 100,000 nodes as fast as possible, it doesn’t make sense to use object mappers.

Use Query Parameters


It’s always important to use query parameters. Take the following query as an example:

MERGE (p:Person {name:"Robert"})
MERGE (p:Person {name:"Chris"})
MERGE (p:Person {name:"Michael"})

This will query the three people mentioned, but Cypher can cache the query plans, so using parameters allows Neo4j to cache the query plan and reuse it next time, which increases query speed.

So, you would change it to look like this, and you’d pass the parameters with the driver:

MERGE (p:Person {name:{name} })

Reuse Identifiers


When generating Cypher queries at the application level, I see a lot of people building incremental identifiers:

MERGE (p1:Person {name:"Robert"})
MERGE (p2:Person {name:"Chris"})
MERGE (p3:Person {name:"Michael"})

Using P1, P2 and P3 (etc.) completely prevents the query plan from being cached, so Cypher will think it’s a new query every time, meaning it has to make statistics, caching, etc.

Let me show you the difference in the demo below:


Split Long Queries


Avoid long Cypher queries (30-40 lines) when possible by splitting your queries into smaller, separate queries.

You can then run all of these smaller, optimized queries in one transaction, which means you don’t have to worry about transactionality and ACID compliance. A query of two lines is much easier to maintain than one with 20 lines. Smaller queries are also easier to PROFILE because you can quickly identify any bottlenecks in your query plan.

Just remember: A number of small optimized queries always run faster than one long, un-optimized query. It adds a bit of overhead in the code, but in the end, you will really benefit from that overhead.

Check Schema Indexes


Another thing is to check your schema indexes. In the below Cypher query plan, we are creating a range from zero to 10,000, and we will merge a new person node with an ID being the increment in the range:

Check Schema Indexes


So you can see in the query plan that it is doing a node by label scan. If I were to have 1000 people, it would try to find 1000 people checking if the value for the MERGE is the same. If not, it will create a new node.

But whether it’s 1000, 1000000, or 10000000, your query will grow in db hits, so it won’t be as fast as you want it to be.

However, you can address this by creating a constraint, which will automatically create a schema index in the database. It will be an 01 operation. Consider the Cypher query below:

CREATE CONSTRAINT ON (p:Person)
ASSERT p.id IS UNIQUE

If you have a constraint on the person ID, then the next time you do a MERGE — which is a MATCH or CREATE — the MATCH will an 01 operation so it will run very fast. The new query plan is NodeUniqueIndexSeek, which is really an 01 operation.

Batch Your Writes


In our earlier examples, we were creating a new query to create one node. You can defer your writes at the application level for example and keep an array of 1000 operations. You can then use UNWIND, which is a very powerful feature of Neo4j.

Below we are creating an array at the application level, which we pass as a first parameter:

Batch your writes


It will iterate this array and then do an operation: create a person and setting the properties. In this array, the person also has to be connected, so we create person nodes and relationships to the other people.

Below is a demo showing performance differences with and without schema indexes:


Beware of Query Replanning


The following relates to a problem that typically faces more experienced Cypher users in production scenarios. That is, query replanning.

When you are creating a lot of nodes and relationships, the statistics are continually evolving so Cypher may detect a plan as stale. However, you can disable this during batch imports.

Consider the following holiday house recommendations use case: Every house node has 800 relationships to other top-k similar houses based on click sessions, search features and content-based recommendations.

The problem we encountered was that in the background, we were constantly recomputing the similarity in the background, deleting every relationship and recreating new ones to the new 800 top-k similar relationships. But if you were to look in the Neo4j logs, it would always be a query detected as stale, then replanning, then the query being detected as stale, then replanning and so on.

Cypher automatically does query-replanning because of continuous change in statistics, which can slow down queries and introduce higher rates of garbage collection. But there is a configuration in Neo4j that you can use for disabling the replanning from the beginning. Also, this will

The parameters for disabling replanning are:

cypher.min_relplan_interval

and

cypher.statistics_divergence_threshold

The first outlines the parameters for the limited lifetime of a query plan before a query is considered for replanning. The second is the threshold for when a plan is considered stale. If any of the underlying statistics used to create the plan has changed more than this defined value, the plan is considered stale and will be replanned. A value of 0 always means replan, while a value of 1 means never replan.

I discussed with the Cypher authors yesterday, and they are maybe thinking of adding this factor on the query level, because these configurations impact all of your other queries as well.

So this is something you can use for making your writes faster in the first batch import. It is better than restarting Neo4j, because all your MATCH queries and your user-facing queries will be impacted by this.


Inspired by Christophe’s talk? Click below to register for GraphConnect New York on October 23-24, 2017 at Pier 36 in New York City – and connect with leading graph experts from around the globe.

Register for GraphConnect

Graph Algorithms: Make Election Data Great Again

$
0
0
Rank provides a high-level graph algorithm
Editor’s Note: This presentation was given by John Swain at GraphConnect San Francisco in October 2016.

Summary


In this presentation, learn how John Swain of Right Relevance (and Microsoft Azure) set out to analyze Twitter conversations around both Brexit and the 2016 U.S. Presidential election data using graph algorithms.

To begin, Swain discusses the role of social media influencers and debunks the common Internet trope of “the Law of the Few“, rechristening it as “the Law of Quite a Few.”

Swain then dives into his team’s methodology, including the OODA (observe, orient, decide and act) loop approach borrowed from the British Navy. He also details how they built the graph for the U.S. Presidential election and how they ingested the data.

Next, Swain explains how they analyzed the election graph using graph algorithms, from PageRank and betweenness centrality to Rank (a consolidation of metrics) and community detection algorithms.

Ryan Boyd then guest presents on using graph algorithms via the APOC library of user-defined functions and user-defined procedures.

Swain then puts it all together to discuss their final analysis of the U.S. Presidential election data as well as the Brexit data.

Graph Algorithms: Make Election Data Great Again


What we’re going to be talking about today is how to use graph algorithms to effectively sort through the election noise on Twitter:


John Swain: Let’s start right off by going to October 2, 2016, the date we published our first analysis of the data we collected on Twitter conversations surrounding the U.S. Presidential Election.

On that day the big stories were Hillary Clinton’s physical collapse and her comment about the “basket of deplorables” — which included talk about her potentially resigning from the race. It was a very crowded conversation covered intensely by the media. We wanted to demonstrate that, behind all the noise and obvious stories, there were some things contained in this data that were not quite so obvious.

Twitter data election chatter on October 2, 2016


We analyzed the data and created a Gephi map of the 15,000 top users. One of the clusters we identified included journalists, the most prominent of whom was Washington Post reporter David Fahrenthold. Five days later, Fahrenthold broke the story about Donald Trump being recorded saying extremely lewd comments about women.

We’re going to go over how we discovered this group of influencers which, even though there was a bit of luck involved, we hope to show that it wasn’t just a fluke and is in fact repeatable.

In this presentation, we’re going to go over the problem we set out to solve and the data we needed to solve that problem; how we processed the graph data (with Neo4j and R); and how Neo4j helped us overcome some scalability issues we encountered.

I started this as a volunteer project about two years ago with the Ebola crisis, which was a part of the Statistics Without Borders project for the United Nations. We were looking for information like the below in the Twitter conversation about Ebola to identify people who were sharing useful information:

Ebola crisis Twitter chatter


Because there was no budget, I had to use open source software and started with R and Neo4j Community Edition.

I quickly ran into a problem. There was a single case of Ebola that hit the United States in Dallas, which happened to coincide with the midterm elections. The Twitter conversation about Ebola got hijacked by the political right and an organization called Teacourt, all of whom suggested that President Obama was responsible for this incident and that you could catch Ebola in all kinds of weird ways.

This crowded out the rest of the conversation, and we had to find a way to get to the original information that we were seeking. I did find a solution, which we realized we could apply to other situations that were confusing, strange or new — which pretty much described the 2016 U.S. Presidential election.

Debunking the Law of the Few


So, where did we start? It started with something that everybody’s pretty familiar with – the common Internet trope about the “Law of the Few,” which started with Stanley Milgram’s famous experiment that showed we are all connected by six degrees of separation. This spawned things like the Kevin Bacon Index and was popularised by the Malcolm Gladwell book The Tipping Point.

Gladwell argues that any social epidemic is dependent on people with a particular and rare set of social gifts spreading information through networks. Whether you’re trying to push your message into a social network or are listening to messages coming out, the mechanism is the same.

Our plan was to collect the Twitter data, mark these relationships, and then analyze the mechanism for the spread of information so that we could separate out the noise.

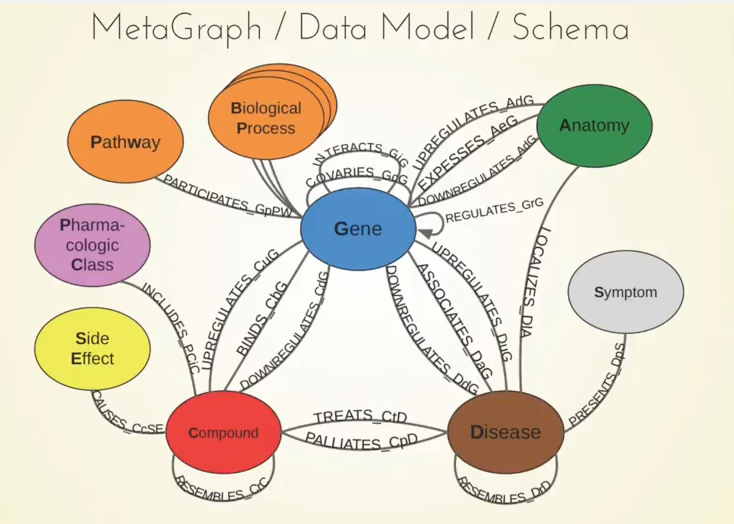
To do this, we collected data from the Twitter API and built a data model in Neo4j:

The data necessary to achieve Right Relevance's goals


The original source code — the Python scripts and important routines for pulling this into Neo4j — is also still available on Nicole White’s GitHub.

However, we encountered a problem. At the scale we wanted to conduct our analysis, we couldn’t collect all of the followers and following information that we wanted because the rate limits on the Twitter API are too limiting. So we hit a full stop and went back to the drawing board.

Through this next set of research, we found two really good books by Duncan Watts — Everything Is Obvious and Six Degrees. He is one of the first people to do empirical research on the Law of the Few (six degrees of separation), which showed that there is actually a problem with this theory because any process that relies on targeting a few special individuals is bound to be unreliable. No matter how popular and how compelling the story, it simply doesn’t work that way.

For that reason, we rechristened it “The Law of Quite a Few” and named the people who are responsible for spreading information through social networks, which are ordinary influencers. These aren’t just anybody; they’re people with some skills, but it’s not just a very few special individuals.

Methodology


We borrowed a methodology from military intelligence in the British Navy called the OODA loop: observe, orient, decide and act. Below is a simplified version:

The OODA Loop


The key thing we learned in the research is that people are not disciplined about following the process of collecting data. Instead we typically perform some initial observations, orient ourselves, decide what’s going on and take some actions — but we shortcut the feedback loop to what we think we know the situation is, instead of going back to the beginning and observing incoming data.

Using a feedback loop like this is essentially hindsight bias:

The OODA loop filter bubble


Hindsight bias is the belief that if you’d looked hard enough at the information that you had, the events that subsequently happened would’ve been predictable — that with the benefit of hindsight we could see how it was going to happen.

This gets perverted to mean that if you’d looked harder at the information you’d had, it would have been predictable, when in fact you needed information you didn’t have at the time. Events aren’t predictable, even if they seem predictable when you play the world backwards.

Building the Graph


Using that methodology, we committed to building the graph with Neo4j. This involved ingesting the data into Neo4j, building a simplified graph, and processing with R and igraph.

Ingesting the Data

The first part of the process is to ingest the data into Neo4j, which gets collected from the Twitter API and comes in as JSON. We scale this up so we can use the raw API rather than the Twitter API, have our libraries in Python, push that into a message queue and store this in a document store, MongoDB.

Whether you’re pulling this from the raw API or whether you’re pulling it from a document store, you get a JSON document. We pushed a Python list into this Cypher query and used the UNWIND command, and included a reference to an article. Now the preferred method is to use the apoc.load.json library:

Code for Neo4j injest


We were interested in getting a simplified version of the graph with only retweets and mentions, which we use to build the graph. We built the following simplified graph, which is just the relationship between each user with a weight for every time a retweet or mention happens.

The R call calls a queryString, which is a Cypher query that essentially says MATCH users who post tweets that mention other users, with some conditions about the time period, that they’re not the same user, etc. Below is the Cypher code:

Processing the graph of Twitter mentions


This builds a very simple relationship list for each pair of users and the number of times in each direction they’re mentioned, which results in a graph that we need to make some sense out of.

Analyzing the Graph: Graph Algorithms


The key point at this stage is that we have no external training data to do things like sentiment analysis because we have a cold start problem. Often we’re looking at a brand-new situation that we don’t have any information about.

The other issue is that social phenomena are inherently unknowable. No one could have predicted that this story was going to break, or that a certain person is going to be an Internet sensation at a certain time. This requires the use of unsupervised learning algorithms to make sense of the graph that we’ve created.

PageRank

The first algorithm we used is the well-known PageRank, a graph algorithm originally used by Google to rank the importance of web pages and is a type of eigenvector centrality algorithm by Larry Page. This ranks web pages or any other node in a graph according to how important it is in relation to all the pages that link to it recursively.

Below is an example of what we can do with PageRank. This is the same graph we started with at the beginning with top PageRank-ed users:

PageRank graph algorithm


Here the three users Hillary Clinton, Joe Biden and Donald Trump heavily skewed the PageRank. There were a couple of other interesting users that we can see from this graph, including Jerry Springer who had an enormous number of retweets. That’s a big number of retweets, and illustrates this temptation to pay special attention to what certain people say.

Looking backwards, it’s very easy to put together a plausible reason why Jerry Springer was so successful. He had some special insight because of the people he has on his show. But the reality is, it was just luck. It could have been one of the 10,000 A-list, B-list, C-list celebrities these days. But it’s tempting to look back and rationalize what happened, and believe that you could have predicted it — but that’s a myth.

Betweenness Centrality

The next graph algorithm we use is betweenness centrality, which for each user measures the number of shortest paths from all the other users that pass through that user. This tends to identify brokers of information in the network, because information is passing through those nodes like an airport hub.

We also calculate some other basic stats from the graph, some of which are collected in degrees, i.e. the overall number of times a user is mentioned or retweeted; retweets, replies and mention count; plus some information returned from the API.

And what we create is a set of derivatives which answer some natural questions. An example of that is a metric that we call Talked About:

Derivatives answer natural questions


The natural question is: who is talked about? This is from the night of the first debate, and measures the ratio of the number of times someone’s retweeted to the number of times they’re mentioned, corrected for number of followers and a couple of other things as well.

Katy Perry is always mentioned more than anyone else simply because she has 80 million followers, so we adjust for that to measure the level of importance from outside the user’s participation in a conversation. For example, there can be an important person who isn’t very active on Twitter or involved in the conversation, but who is mentioned a lot.

On this night, the most talked about person was Lester Holt. He was obviously busy that night moderating the presidential debate and wasn’t tweeting a lot, but people were talking about him.

Rank: Consolidated Metrics

We consolidate all of these metrics into overall measure that we call Rank:

Rank provides a high-level graph algorithm


Rank includes PageRank, betweenness centrality and a measure we call Interestingness, which is the difference between what someone’s PageRank is and what would you expect that PageRank to be given a regression on various factors like number of followers and reach. Someone who has a very successful meme that’s retweeted a lot and gets lots of mentions can be influential in networks, but we try to correct for that as just being noise instead of actually valuable information.

This image above is the same graph as before, and it’s natural that Donald Trump and Hillary Clinton are continually the top influencers in their network on any graph of this subject. But Rank evens out those distortions and skews from some other metrics to give you a good idea of who was genuinely important.

We’re talking about influencers, which is not something you can directly measure or compare. There’s not necessarily any perfect right or wrong answer, but you get a good indication on any given time period who has been important or influential in that conversation.

Community Detection Algorithm

Community detection separates groups of people by the connections between them. In the following example it’s easy to see the three distinct communities of people:

Community detection algorithm


In reality, we’re in multiple communities at any given time. We might have a political affiliation but also follow four different sports teams. The algorithms that calculate this non-overlapping membership of communities are very computationally intensive.

Our solution was to run a couple of algorithms on multiple subgraphs. We take subgraphs based on in-degree types of giant components, which is the most centrally connected part of the graph, run those several times and bring together the results to create a multiple membership.

When you visualize this, it looks something like the below. This is back to the U.K. Brexit conversation, with about two million tweets in this particular example:

Brexit tweets: retweets vs. mentions

We have two types of graphs above: one based on retweets and one based on mentions. The “retweets” graph always creates this clear separation of communities. No matter what people say on their Twitter profiles, retweets do mean endorsements on aggregate; people congregate very clearly in groups where they share common beliefs.

Mentions including retweets gives you a very different structure is not quite so clear. You can see that there are two communities, but there’s a lot more interaction between them.

The same is true with the community detection algorithms. The two we most frequently use are Walktrap and Infomap. Walktrap tends to create fewer, larger communities. When you combine that with retweets, you get a very clear separation.

Conversely the Infomap algorithm creates a number of much smaller communities. In this case it wasn’t a political affiliation, it was a vote to either leave the EU or to remain – a very clear separation. At the same time, people’s existing political affiliations overlap with that vote. It’s not usually this easy to see on the 2D visualization with colour, but you get some idea of what’s going on.

At this point, we get some sense of what’s going on in the conversation. If we go back to the first U.S. presidential debate, below is the community that we detected for Joe Biden:

Joe Biden's twitter flock


We call these kinds of communities – which are people active in that conversation in a certain period of time – flocks. These results are from totally unsupervised learning. And you can that by and large, it pretty accurately relates a coherent, sensible community of people sharing certain political affiliations.

We were happy going along doing this kind of analysis and getting bigger and bigger graphs. And then the Brexit campaign created this huge volume of tweets, and we a hit brick wall in scalability. We realized that we didn’t have the capacity to handle 20 million tweets each week, and we needed to scale the graph algorithms.

We looked at various options, including GraphX on Apache Spark, but after talking to Ryan and Michael we found that we could do this natively in Neo4j using APOC. We’re currently processing about 20 million tweets, but our target is to reach a capacity to do a billion-node capacity. And Ryan Boyd with Neo4j is going to talk more about that.

Neo4j User-Defined APOC Procedures


Ryan Boyd: Let’s start with an overview of user-defined procedures, which are the ability to write code that executes on the Neo4j server alongside your data:

User defined procedures in Java


To increase the performance of any sort of analytics process, you can either bring the processing to the data, or the data to the processing. In this case we’re moving to processing to the data. You have your Java Stored Procedure that runs in the database, Neo4j can call that through Cypher and your applications can also issue Cypher requests.

At the bottom of the image is an example call, and as a procedure the YIELD results. First you use the APOC feature to create a UUID, a timestamp of the current time, and to CREATE a node and include that UUID and the timestamp that was yielded from those first two procedures.

You can do this all in Cypher but now Neo4j 3.1 has user-defined functions, which allow you to call these as functions rather than procedures:

User-defined functions in Java


If you look at the bottom right where you CREATE your document node, you can set the ID property to the apoc.create.uuid and then set the CREATE property to be apoc.date.format and your timestamp. This makes it easier to call directly.

We’ve taken a lot of the procedures in the APOC library and converted them to functions wherever it made sense, and the next version of APOC is out there for testing the 3.1 version.

APOC is an open source library populated with contributions from the community, including those from Neo4j. It has tons of different functionality: to call JDBC databases, to integrate with Cassandra or Elasticsearch, ways to call HDP APIs and integrate pulling data in from web APIs like Twitter.

But it also has things like graph algorithms. John’s going to talk a bit more about their work with graph algorithms that they have written and contributed as a company to the open source APOC library that is now accessible to everyone.

Swain: We’ve started creating the graph algorithms that we are going to need to migrate everything from running the algorithms in igraph in R, to running it natively in Neo4j.

We started with PageRank and betweenness centrality, and we are working on two community detection algorithms: Walktrap and Infomap. Everything is available on GitHub, and we hope that people will contribute and join us. It’s just the tip of the iceberg, and we have a long way to go until we can complete the process and run this end-to-end.

Below is the result from three different time periods of our Brexit data:

Brexit Twitter analysis graph algorithm results


The igraph implementation of PageRank is pretty efficient, so we’re only getting a relatively minor performance improvement. But with betweenness centrality we have a much larger performance improvement.

Because we can run this natively in Neo4j, we don’t have to build that graph projection and move it into igraph, which is a big win. When we do this with R, on fairly small graphs we get a huge improvement, but at a certain point we just run out of memory.

Putting It All Together


Let’s turn back to where we started and how we discovered what we discovered. We had to pull together important people in the conversation (flocks), topics of conversation, and topical influence (tribes):

Special people vs. ordinary influencers


We’ve already gone over special people versus ordinary influencers. With the Right Relevance system we have approximately 2.5 million users on 50,000 different topics, and we give everyone a score of their topical influence in those different topics.

Let’s turn back to journalist David Fahrenthold, who has significant influence in lots of related topics – some of which were in that conversation that we looked at right at the beginning.

What we’re trying to do is find the intersection of three things: The conversation, the trending topics — the topics that are being discussed in that conversation — and the tribes. The topics are defined by an initial search, but it can be quite difficult defining the track phrases they’re called for pulling data from a Twitter API.

This means you can get multiple conversations and still not really know what the topics are going to be. This kind of influence is what we call tribes. People who are in the same tribe tend to have the same intrinsic values, demographic and psychographic qualities.

People who support a football team are the perfect example of a tribe because it changes only very slowly, if at all. If I support Manchester United, I might not be doing anything about that quality today. But if I’m going to a game, look at a particular piece of news about players being signed, or whatever, then I’m engaged in a conversation. People who are involved in that conversation are organized in flocks.

Below is Twitter information that was pulled on September 11:

Right relevance Twitter flocks


This image above includes trending terms, hashtags, topics and users. The people in this conversation had expertise or influence in these topics. That’s just a filter which selects the people in that flock, so it is now the intersection between people with certain topical influence and people in a certain flock, which includes active reporters and journalists.

You have to be really careful with reviewing and going back to the observation phase. Below is a later analysis, which shows something happening slowly but detectably, and we expected after the next debate that this process would accelerate.

Basically, establishment commentators and media have gradually become more and more prevalent in the Hillary Clinton side of the graph, leaving the Trump side of the graph quite sparse in terms of the number of influencers:

Clinton shift in the twittersphere


Everyone on the Hillary side of the network was starting to listen more and more to those people, and the information was filtered and became self-reinforcing.

It’s very similar to what we detected on Brexit, only it’s the other way around:

Brexit Twitter analysis


The “remain” side was very much establishment and the status quo, so people were not so active. Whereas in the US presidential election both sides were very active, which is one main difference. In the Brexit campaign in the U.K., anybody who was anybody really was supporting remain. The main proponents of Brexit didn’t really believe it was going to happen, but it did. There was a complacency on the other side, and the turnout ended up being very low.


Inspired by Swain’s presentation? Click below to register for GraphConnect New York on October 23-24, 2017 at Pier 36 in New York City – and connect with leading graph experts from around the globe.

Get My Ticket

This Week in Neo4j – 16 September 2017

$
0
0

Welcome to this week in Neo4j where we round up what’s been happening in the world of graph databases in the last 7 days.


This week’s featured community member is Bruno Peres, Programmer at GeoSapiens.

Bruno Peres - This Week's Featured Community Member

Bruno Peres – This Week’s Featured Community Member

If you’ve been following TWIN4j you’ll almost certainly have heard Bruno mentioned in previous editions – he’s one of the most frequent answerer of Neo4j and Cypher questions on StackOverflow.

Every week when I write this blog post I take a look at the StackOverflow active tab on the Neo4j community graph, and Bruno is always in the top 3.

I’ve learnt some cool things from reading Bruno’s answers such as how to add a temporary property to a node using map projections and just this week how to write a query that finds the intersection of multiple starting nodes.

On behalf of the StackOverflow and Neo4j communities, thanks for all your work Bruno!

Online Meetup: Analysing the Kaggle Instacart dataset


In this week’s online meetup Jonathan Freeman showed us how to analyse the data from Kaggle‘s Instacart Market Basket Analysis competition.


Jonathan shows how to import a subset of the dataset using Cypher’s LOAD CSV clause before using the neo4j-import tool to load the full dataset.

He also writes queries to find vegetarians, vegans, and proposes Instafood – an (at the moment) imaginary application that sets people up on dates based on common food preferences!


Graphoetry: Poetry about graphs


For something different this week we’ve got a poem about graph databases written by Dom Gittins.


On StackOverflow: MERGE confusion, Subqueries, Shortest path with predicate checks


This week on Neo4j StackOverflow…​

From The Knowledge Base


This week in the Neo4j Knowledge Base Rohan Kharwar shows how to write a Cypher query to kill transactions that take longer than X seconds and don’t contain certain keywords.

Telegram Recipes bot, Chemistry Recommendation Engine, Feature Toggles Graph


    • Alexey Kalina created RecipesTelegramBot, a Telegram bot that makes recipe recommendations.
    • Richard J. Hall, Christopher W. Murray, and Marcel L. Verdonk published The Fragment Network: A Chemistry Recommendation Engine Built Using a Graph Database. The authors run a series of algorithms over Chemical compounds to generate a graph of 23 million nodes and 107 million relationships explaining the similarity between them.
    • Pedro Moreira created toggling-it, an application that lets you create toggles for your applications based on toggle-groups and tags. You can also run “what if” analysis to see the knock on effects of enabling/disabling your toggles.
    • I came across python-norduniclient, a Neo4j database client for NORDUnet network inventory. NORDUni is a project for documenting and presenting physical network infrastructure as well as the logical connections between customers, services and hardware. It stores inventory data models in Neo4j.

Tweet of the Week


My favourite tweet this week was by Urmas Heinaste:

Don’t forget to RT if you liked it too.

That’s all for this week. Have a great weekend!

Cheers, Mark

This Week in Neo4j – 30 September 2017

$
0
0

Welcome to this week in Neo4j where we round up what’s been happening in the world of graph databases in the last 7 days.


This week’s featured community member is Sylvain Roussy, Director of R&D at Blueway Software.

Sylvain Roussy - This Week's Featured Community Member

Sylvain Roussy – This Week’s Featured Community Member

Sylvain has been a member of the Neo4j community for a number of years now, and is the author of a French book on Neo4j – Des données et des graphes. He is currently working on a new book which demonstrates developing an graph based application from idea to production. All presented in dialogues of the project team.

He’s also been organising the Neo4j meetup in Lyon since 2014.

On behalf of the Neo4j community thanks for all your work Sylvain!

Online Meetup: Building Conversational Experiences with Amazon Alexa and Neo4j


In this week’s online meetup GraphAware‘s Christophe Willemsen showed us how to combine Amazon Alexa and Neo4j to build great conversational experiences.


You can catch a live version of this talk at GraphConnect NYC 2017. Christophe will also be hanging out in the DevZone giving demos of the Alexa to anyone who’s interested.

Graphing metaphors, Building a Source Code Schema, GraphQL and GoT


Neo4j, Fraud Detection, and Python


The Data Science Milan group recently hosted an event which focused on different data science applications that are made possible using graph databases.


The video contains a mix of talks in English and Italian – the one in English is about 50 minutes in so if you’re language challenged like me you’ll want to skip forwards to there.

On the podcast: Tomaz Bratanic


This week on the podcast Rik interviewed Tomaz Bratanic, who’s written many great blog posts that we’ve featured in previous versions of TWIN4j.

Tomaz and Rik talk about Tomaz’s move from playing poker to coding fulltime, why he loves the Cypher query language, and more!

Tweet of the Week


My favourite tweet this week was by Max Sumrall, my former colleague on the Neo4j clustering team:

Don’t forget to RT if you liked it too.

That’s all for this week. Have a great weekend!

Cheers, Mark

Analyzing Twitter Hashtag Impact using Neo4j, Python & JavaScript

$
0
0
Learn how to analyze the impact of a Twitter hashtag using Neo4j, Cypher, Python and JavaScript
This is the first demo I developed with Neo4j. The objective of the demo is to open the discussion about graph databases, Neo4j, big data, analytics and IBM Power Systems with our global customers.

I decided to use Twitter as a data source so that the demo leverages public data (on Twitter) and could be customized by loading the database with tweets related to a specific customer. Now, there are a lot of things you can show from the tweets, but for my first iteration of the demonstration, I decided to keep it simple and try to answer the following questions: “When people talk about topic ‘X,’ what else do they talk about?”

Translated into the language of Twitter: “For people who use hashtag #X, what other hashtag(s) do they use?”

In order to visualize the result in an interesting way, why not try to figure out the location of those people in order to plot the results on a world map, leveraging the location information Twitter provides from consenting users.

Step 1: Figuring out the Data Model


The first step was to figure out the data model: How do I represent the twitter data inside my Neo4j database? I picked the following:

Nodes:
    • User nodes – represents a Twitter user (handle and number of followers)
    • Tweet nodes – represent a tweet (text, number of likes)
    • Hashtag nodes – represent a hashtag
    • Country nodes – represent a country (country name, country code)
Relationships:
    • TWEETED relationship – in between a User and a Tweet; indicates that this user is the author of the tweet; also indicates the date at which it was tweeted
    • RETWEETED relationship – in between a User and a Tweet; indicates this user retweeted this tweet; also indicates the date at which it was retweeted
    • HAS_HASHTAG relationship – in between a Tweet and a Hashtag
    • USED_HASHTAG relationship – in between a User and a Hashtag
    • MENTIONED relationship – in between two Users
    • FROM relation – in between a User and a Country

Step 2: Data Import


Next, I needed to get some Twitter data inside Neo4j.

I decided to go with a Python Twitter Library: python-twitter. Coupled with the Neo4j Bolt Driver for Python I quickly was able to get my nodes and relationship in the database:

Twitter data import to Neo4j


Step 3: Graph Visualization


For the visualization part, I stumbled upon a great JavaScript library: Datamaps, which makes it easy to display anything on a map.

A simple HTML page with some JavaScript, coupled with a Python backend script allowed me to quickly query the Neo4j database from the web front-end and get the data back, ready to display on the map:

Learn how to analyze the impact of a Twitter hashtag using Neo4j, Cypher, Python and JavaScript


The web page requires two steps from the user:

1. Input a hashtag, or select it from the top 20 hashtags already in the database.

This triggers a query to the Neo4j database which will look for all the users who used this hashtag, and then it looks at the tweets from those users, and finally the hashtags contained in those tweets. It will then sum up the number of times each hashtag has been used and then combine it with the number of followers of the users who used it and come up with the top eight hashtags.

Here is what the Cypher query looks like:

MATCH (h:Hashtag)<-[r:HAS_HASHTAG]-(t:Tweet)<-[r2]-(u:User)-
      [r3:USED_HASHTAG]->(h2:Hashtag {text: $hashtag})
WHERE h <> h2
WITH sum(toInteger(u.followers)) AS number, h.text as hashtag
RETURN hashtag, number
ORDER by number DESC
LIMIT 8

2. Select one of the hashtags in the top eight that got returned by the database.

This will trigger another query to the database which will look for all users that tweeted or retweeted tweets that contain this hashtag and who also used the hashtag selected during step 1.

It will then figure out the country of those users are and aggregate the number of followers of those users per country to finally return a list of countries, and a number which represents how much “impact” this hashtag had in this country (with impact being how many potential people read the tweets).

The Cypher query looks like this:

MATCH (h:Hashtag {text: $hashtag2})<-[r:HAS_HASHTAG]-(t:Tweet)<-[r2]-
      (u:User)-[r3:USED_HASHTAG]->(h2:Hashtag {text: $hashtag})
MATCH (u)-[rf:FROM]->(c:Country)
WHERE h <> h2
WITH sum(toInteger(u.followers)) AS number, h.text AS hashtag, 
     c.lat AS lat, c.lon AS lon, c.code AS country_code
RETURN country_code, lat, lon, hashtag, number
ORDER by number DESC

Once the second step is done and the Cypher query returns the data, a bit of JavaScript formats it for Datamaps to draws bubbles on the map. Each bubble is located over the country where users have been identified in the query, and the size of the bubble represents the “impact” of the hashtag selected in step 2.

What’s Next for the Twitter Demo


The demo is evolving and I plan to show it live in person at GraphConnect New York at the IBM booth.

I want to add in the possibility to select data from a given time frame, and while I store the @mentions of other users within the database the demo doesn’t yet leverage this information. I also know it would be interesting to use some machine learning algorithms to figure out more hidden patterns in the data and to find new ways to display those patterns.

I also started playing with some of the brand new Neo4j graph algorithms especially the Connected Components and Strongly Connected Components, and they both seem to work nicely with the MENTIONED relationship, so we’ll get to use that data soon.

At the start of this project, I had no experience using Neo4j as a developer. I was surprised how easy it was to connect to Neo4j and interact with the Neo4j database.

I expected I would spend most of the time trying to figure out how to connect, run queries and then read the results. It turned out to be one of the easiest part in the development of that demo, probably thanks to the great documentation available.


IBM is a Gold sponsor of GraphConnect New York. Use discount code IBMCD50 to get 50% off your tickets and trainings.


Tickets are going fast:
Get your ticket to GraphConnect New York and we’ll see you on October 24th at Pier 36 in Manhattan!


Sign Me Up

Forrester Research: Graph Databases Vendor Landscape [Free Report]

$
0
0
Learn from Forrester Research on the state of the graph database technology vendor landscape
Learn from Forrester Research on the state of the graph database technology vendor landscape In 2015, analyst firm Forrester Research published a vendor landscape report on the state of graph databases. It included a few graph technology vendors, several graph use cases and described Neo4j as the “most popular graph database.” Since then, graph database technology has come a long way.

Now, Forrester has reissued their graph databases vendor landscape report with a greater number of vendors, an explosion of new graph use cases and the analysis that “Neo4j continues to dominate the graph database market.”

Connected Data Is Creating New Business Opportunities


Here’s a preview of what’s included in this newest vendor landscape report by Noel Yuhanna:

It’s all about connected data! Connecting data helps companies answer complex questions, such as “Is David’s credit card purchase a fraud, given his buying patterns, the type of product that he is buying, the time and location of the purchase, and his likes and dislikes?” or “From the thousands of products, what is Jane likely to buy next given her buying behavior, products she has reviewed, her purchasing power, and other influencing factors?”

Developers could write Java, Python, or even SQL code to get answers to such complex questions, but that would take hours or days to program and in some cases might be impractical. What if business users want answers to such ad hoc questions quickly, with no time for custom code or with no access to the technical expertise needed to write those programs?

While organizations have been leveraging connections in data for decades, the need for rapid answers amid radical changes in data volume, diversity, and distribution has driven enterprise architects to look for new approaches.
That approach is to use graph database technology to leverage connected data for a sustainable competitive advantage.

You Don’t Have to Take Our Word for It


Throughout this detailed analyst report, Yuhanna gives you example after example of how today’s leading enterprises are using graph technology to transform their industries and disrupt the competition. You will walk away from this report with well-formed ideas and plans on how to apply graph-powered solutions to your industry and circumstances.

While we believe the Neo4j native graph database is the market leader, you don’t have to take our word for it – you’ll get side-by-side comparisons of the various strengths and trade-offs of today’s leading graph database vendors so that you can decide which technology is best fit for your organization and use case. We believe the choice will be obvious.

I highly encourage you to download this limited-time offer for a free copy of the Forrester Research report Vendor Landscape: Graph Databases: Leverage Graph Databases To Succeed With Connected Data by clicking below.


Click below to get your free copy of Vendor Landscape: Graph Databases from Forrester Research – this analyst report will only be available for a limited time:

Get My Free Report

This Week in Neo4j – NBC Russian Twitter Trolls, Spring Boot, GRAND stack

$
0
0

Welcome to this week in Neo4j where we round up what’s been happening in the world of graph databases in the last 7 days.

This week we have a sandbox to play around with NBC’s Russian Twitter Trolls dataset, modelling Pentaho ETL jobs and flights with Neo4j, a Python Cypher Querybuilder, Spring Boot, and more.


This week’s featured community member is Gábor Szárnyas, Research assistant at Hungarian Academy of Sciences.

Gábor Szárnyas - This Week’s Featured Community Member

Gábor Szárnyas – This Week’s Featured Community Member

Gábor has been part of the Neo4j community for several years and is currently working on a PhD which contains several graph related topics. He’s researching how to incrementally query graphs and benchmark such an incremental graph query engine as well as analysing multiplex networks. He featured on the Graphistania podcast in February 2017 where he explained this in more detail.

Gábor is an active participant in the openCypher community and presented ingraph: Live Queries on Graphs at GraphConnect Europe 2017. You can also find the slides from the talk. More recently Gábor showed how to compile openCypher graph queries with Spark Catalyst and presented graph-based source code analysis at FOSDEM 2018.

On behalf of the openCypher and Neo4j communities, thanks for all your work Gábor!

Pick of the week: NBC’s Russian Troll Tweets Database


They’ve also written a couple of posts where they analyse the data.

Will Lyon has written a post showing how to explore The Russian Twitter Trolls Database In Neo4j including a new Neo4j sandbox prepopulated with the dataset. You can get up and running with that in just a couple of minutes at neo4j.com/sandbox.

7,000 Slack Users!


This week we had our 7,000th member of the community registered on the Neo4j-Users Slack, getting questions answered and helping others with their Neo4j journey.

7,000 Users on Neo4j Slack

7,000 Users on Neo4j Slack

Since 2015 there have been just under 400,000 messages posted and around 500 active users per day. This is still the best place to get help with your Cypher query, Cluster configuration, or data import questions.

Thank you to everybody who’s helped others get up to speed with graphs and if you haven’t already joined, what are you waiting for?!

Neo4j gRaphs, Spring Boot, GRAND stack


Next Week


What’s happening next week in the world of graph databases?

Date Title Group Speaker

February 19th 2017

Algorithms, Graphs and Awesome Procedures

GraphDB Sydney

Joshua Yu

February 20th 2017

Tales of Graph Analytics with Neo4j

Graph Database – Israel

Yehonathan Sharvit, Tal Shainfeld, Svetlana Yaroshevsky

Tweet of the Week


My favourite tweet this week was by Andrew Lovett-Barron:

Don’t forget to RT if you liked it too.

That’s all for this week. Have a great weekend!

Cheers, Mark

Now You Can Express Cypher Queries in Pure Python using Pypher [Community Post]

$
0
0
Learn more about the Pypher library that allows you to express Cypher queries in pure Python
Learn more about the Pypher library that allows you to express Cypher queries in pure PythonCypher is a pretty cool language. It allows you to easily manipulate and query your graph in a familiar – but at the same time – unique way. If you’re familiar with SQL, mixing in Cypher’s ASCII node and relationship characters becomes second nature, allowing you to be very productive early on.

A query language is the main interface for the data stored in a database. In most cases, that language is completely different than the programming language interacting with the actual database. This results in query building through either string concatenation or with a few well-structured query-builder objects (which themselves resolve to concatenated strings).

In my research, the majority of Python Neo4j packages either offered no query builder or a query builder that is a part of a project with a broader scope.

Being a person who dislikes writing queries by string contention, I figured that Neo4j should have a simple and lightweight query builder. That is how Pypher was born.

What Is Pypher?


Pypher is a suite of lightweight Python objects that allow the user to express Cypher queries in pure Python.

Its main goals are to cover all of the Cypher use-cases through an interface that isn’t too far from Cypher and to be easily expandable for future updates to the query language.

What Does Pypher Look Like?

from pypher import Pypher

p = Pypher()
p.Match.node('a').relationship('r').node('b').RETURN('a', 'b', 'r')

str(p) # MAtCH ('a')-['r']-('b') RETURN a, b, r

Pypher is set up to look and feel just like the Cypher that you’re familiar with. It has all of the keywords and functions that you need to create the Cypher queries that power your applications.

All of the examples found in this article can be run in an interactive Python Notebook located here.

Why Use Pypher?

    • No need for convoluted and messy string concatenation. Use the Pypher object to build out your Cypher queries without having to worry about missing or nesting quotes.
    • Easily create partial Cypher queries and apply them in various situations. These Partial objects can be combined, nested, extended and reused.
    • Automatic parameter binding. You do not have to worry about binding parameters as Pypher will take care of that for you. You can even manually control the bound parameter naming if you see fit.
    • Pypher makes your Cypher queries a tad bit safer by reducing the chances of Cypher injection (this is still quite possible with the usage of the Raw or FuncRaw objects, so be careful).
Why Not Use Pypher?

    • Strings are a Python primitive and could use a lot less memory in long-running processes. Not much, but it is a fair point.
    • Python objects are susceptible to manipulation outside of the current execution scope if you aren’t too careful with passing them around (if this is an issue with your Pypher, maybe you should re-evaluate your code structure).
    • You must learn both Cypher and Pypher and have an understanding of where they intersect and diverge. Luckily for you, Pypher’s interface is small and very easy to digest.
Pypher makes my Cypher code easier to wrangle and manage in the long run. It allows me to conditionally build queries and relieves the hassle of worrying about string concatenation or parameter passing.

If you’re using Cypher with Python, give Pypher a try. You’ll love it.

Examples


Let’s take a look at how Pypher works with some common Cypher queries.

Cypher:

MATCH (u:User)
RETURN u

Pypher:

from pypher import Pypher, __

p = Pypher()
p.MATCH.node('u', labels='User').RETURN.u

str(p) # MATCH (u:`User`) RETURN u

Cypher:

OPTIONAL MATCH (user:User)-[:FRIENDS_WITH]-(friend:User)
WHERE user.Id = 1234
RETURN user, count(friend) AS number_of_friends

Pypher:

p.OPTIONAL.MATCH.node('user', 'User').rel(labels='FRIENDS_WITH').node('friend', 'User')
# continue later
p.WHERE.user.__id__ == 1234
p.RETURN(__.user, __.count('friend').alias('number_of_friends'))

str(p) # OPTIONAL MATCH (user:`User`)-[FRIENDS_WITH]-(friend:`User`) 
WHERE user.`id` = $NEO_964c1_0 RETURN user, count($NEO_964c1_1) 
AS $NEO_964c1_2
print(dict(p.bound_params)) # {'NEO_964c1_0': 1234, 'NEO_964c1_1': 'friend',
'NEO_964c1_2': 'number_of_friends'}

Use this accompanying interactive Python Notebook to play around with Pypher and get comfortable with the syntax.

So How Does Pypher Work?


Pypher is a tiny Python object that manages a linked list with a fluent interface.

Each method, attribute call, comparison or assignment taken against the Pypher object adds a link to the linked list. Each link is a Pypher instance allowing for composition of very complex chains without having to worry about the plumbing and how to fit things together.

Certain objects will automatically bind the arguments passed in replacing them with either a randomly generated or user-defined variable. When the Pypher object is turned into a Cypher string by calling the __str__ method on it, the Pypher instance will build the final dictionary of bound_params (every nested instance will automatically share the same Params object with the main Pypher object).

Pypher also offers partials in the form of Partial objects. These objects are useful for creating complex, but reusable, chunks of Cypher. Check out the Case object for a cool example on how to build a Partial with a custom interface.

Things to Watch Out for


As you can see in the examples above, Pypher doesn’t map one-to-one with Cypher, and you must learn some special syntax in order to produce the desired Cypher query. Here is a short list of things to consider when writing Pypher:

Watch Out for Assignments

When doing assignment or comparison operations, you must use a new Pypher instance on the other side of the operation. Pypher works by building a simple linked list. Every operation taken against the Pypher instance will add more to the list and you do not want to add the list to itself.

Luckily this problem is pretty easy to rectify. When doing something that will break out of the fluent interface it is recommended that you use the Pypher factory instance __ or create a new Pypher instance yourself, or even import and use one of the many Pypher objects from the package.

p = Pypher()

p.MATCH.node('p', labels='Person')
p.SET(__.p.prop('name') == 'Mark)
p.RETURN.p

#or

p.mark.property('age') <= __.you.property('age')

If you are doing a function call followed by an assignment operator, you must get back to the Pypher instance using the single underscore member

p.property('age')._ += 44

Watch Out for Python Keywords

Python keywords that are either Pypher Statement or Func objects are in all caps. So when you need an AS in the resulting Cypher, you simply write it as all caps in Pypher.

p.RETURN.person.AS.p

Watch Out for Bound Parameters

If you do not manually bind params, Pypher will create the param name with a randomly generated string. This is good because it binds the parameters; however, it also doesn't allow the Cypher caching engine in the Neo4j server to property cache your query as a template.

The solution is to create an instance of the Param object with the name that you want to be used in the resulting Cypher query.

name = Param('my_param', 'Mark')

p.MATCH.node('n').WHERE(__.n.__name__ == name).RETURN.n

str(p) # MATCH (n) WHERE n.`name` = $my_param RETURN n
print(dict(p.bound_params)) # {'my_param': 'Mark'}

Watch Out for Property Access

When accessing node or relationship properties, you must either use the .property function or add a double underscore to the front and back of the property name node.__name__.

Documentation & How to Contribute


Pypher is a living project, and my goal is to keep it current with the evolution of the Cypher language. So if you come across any bugs or missing features or have suggestions for improvements, you can add a ticket to the GitHub repo.

If you need any help with how to set things up or advanced Pypher use cases, you can always jump into the Neo4j users Slack and ping me @emehrkay.

Have fun. Use Pypher to build some cool things and drop me a link when you do.


Take your Neo4j skills up a notch:
Take our online training class, Neo4j in Production, and learn how to scale the #1 graph platform to unprecedented levels.


Take the Class

This Week in Neo4j – Graph Visualization, GraphQL, Spatial, Scheduling, Python

$
0
0

Welcome to this week in Neo4j where we round up what’s been happening in the world of graph databases in the last 7 days. As my colleague Mark Needham is on his well earned vacation, I’m filling in this week.

Next week we plan to do something different. Stay tuned!


Jeffrey A. Miller works as a Senior Consultant in Columbus, Ohio supporting clients in a wide variety of topics. Jeffrey has delivered presentations (slides) at regional technical conferences and user groups on topics including Neo4j graph technology, knowledge management, and humanitarian healthcare projects.

Jeffrey A. Miller - This Week’s Featured Community Member

Jeffrey A. Miller – This Week’s Featured Community Member

Jeffrey published a really interesting Graph Gist on the Software Development Process Model. He was recently interviewed at the Cross Cutting Concerns Podcast on his work with Neo4j.

Jeffrey and his wife, Brandy, are aspiring adoptive parents and have written a fun children’s book called “Skeeters” with proceeds supporting adoption.

On behalf of the Neo4j community, thanks for all your work Jeffrey!


    • The infamous Max De Marzi demonstrates how to use Neo4j for a common meeting room scheduling task. Quite impressive Cypher queries in there.
    • Max also demos another new feature of Neo4j 3.4 – geo-spatial indexes. In his blog post, he describes how to use them to find the right type of food place for your tastes via the geolocation of the city that you’re both in.
    • There seems to be a lot of recent interest in Python front-ends for Neo4j, Timothée Mazzucotelli created NeoPy which is early alpha but contains some nice ideas
    • Zeqi Lin has a number of cool repositories of importing different types of data into Neo4j, e.g. Java classes, Git Commits or parts of Docx documents, and even SnowGraph a software data analytics platform built on Neo4j.
    • I think I came across this before, but the newrelic-neo4j is really a neat way of getting Neo4j metrics into NewRelic, thanks Ștefan-Gabriel Muscalu. While browsing his repositories I also came across this WikiData Neo4j Importer which I need to test out
    • This AutoComplete system uses Neo4j which stores terms, counts and other associated information. It returns top 10 suggestions for auto-complete and tracks usage patterns.
    • Sam answered a question on counting distinct paths on StackOverflow
Nigel is teasing us

A new version of py2neo is coming soon. Designed for Neo4j 3.x, this will remove the previously mandatory HTTP dependency and include a new set of command line tools and other goodies. Expect an alpha release within the next few days.

Graph Visualizations


I had some fun this week with 3d-force-graph and neo4j. It was really easy to combine the 3d graph visualization project based on three.js and available in 2D, 3D, for VR and as React Components with the Neo4j javascript driver. The graphs up to 5000 relationships load sub-second.

See the results of my experiments in my repository which also links to several live versions of different setups (thanks to rawgit)

weights got

My colleague Will got an access key to Graphistry and used this Jupyter Notebook to load the Russian Twitter trolls from Neo4j.

graphistry1

I also came across another Cytoscape plugin for Neo4j, which looks quite useful.

Zhihong SHEN created a Data Visualizer for larger Neo4j graphs using vis.js, you can see an online demo here

Desktop & GraphQL


This weeks update of Neo4j Desktop has seen the addition of the neo4j-graphql extension that our team has been working on for a while.

There will be more detail around it from Will next week but I wanted to share a sneak preview for all of you that want to have some fun with GraphQL & Neo4j over the weekend.


Next Week


What’s happening next two weeks in the world of graph databases?

Date Title Group Speaker

April 3rd

Importer massivement dans une base graphe !

GraphDB Lyon

Gabriel Pillet

April 5th

GraphTour Afterglow: Lightning Talks

GraphDB Brussels

Tom Michiels, Dirk Vermeylen, Ignaz Wanders, Surya Gupta

April 9-10th

Training – Neo4j Masterclass – Amsterdam

GoDataDriven

Ron van Weverwijk

April 10th

Training – Atelier – Les basiques Neo4j – Paris

Paris

Benoit Simard

April 10th

Meetup – The Night Before the Graphs – Milan

Milan

Michele Launi, Matteo Cimini, Roberto Franchini, Omar Rampado, Alberto De Lazzari

April 11th

Conference – Neo4j GraphTour – Milan

Milan

several

April 12th

Training Data Modeling

Milan

Lorenzo Speranzoni, Fabio Lamanna

April 12th

Neo4j GraphTour USA #1

Arlington, VA

several

April 12th

Meetup: Paradise Papers

Munich

Stefan Armbruster

April 13th

Training Graph Data Modeling

Amsterdam

Kees Vegter

April 29th

Searching for Shady Patterns

PyData London

Adam Hill

Tweet of the Week


My favourite tweet this week was our own Easter Bunny

Don’t forget to RT if you liked it too.

That’s all for this week. Have a great weekend! And Happy Easter or Passover, if you celebrate it.

Cheers, Michael

This Week in Neo4j – Tensorflow, Neo4j Spatial, New A* Algorithm, Certification Tips

$
0
0

Welcome to this week in Neo4j where we round up what’s been happening in the world of graph databases in the last 7 days.

This week we have product review predictions with Tensorflow and Neo4j, tips and tricks for passing the Neo4j Certification, combining Neo4j APOC spatial functions with the Neo4j Graph Algorithms A* Algorithm, and more.


This week’s featured community member is Fabio Lamanna, Consultant at LARUS Business Automation.

Fabio Lamanna - This Week’s Featured Community Member

Fabio Lamanna – This Week’s Featured Community Member

Fabio has a background in transportation networks, urban mobility and data analysis and I first came across him from his work analysing migration patterns in 2017.

Fabio presented at the Data Science Milan meetup last September, where he showed how to combine Neo4j and Python (Italian) and last week presented Discovering the Power of Graph Databases with Python and Neo4j at PyCon Italia.

On behalf of the Neo4j community, thanks for all your work Fabio!

GraphQL, Neo4j Certification, A* Algorithm


Tensorflow and Neo4j, New Release of Pypher, Cypher on Node-RED


    • David Mack has written a new installment in his series of posts on graph based machine learning. This time he creates an embedding to predict product reviews using Neo4j and Tensorflow.
    • Mark Henderson released version 0.7 of Pypher, a small library that aims to make it easier to use Neo4j from Python by constructing Cypher queries from pure Python objects. This version includes property map, map, and map projection support, as well as a simple CLI app that allows you test your Pypher scripts in real time.
    • sandman0 released node-red-contrib-nulli-neo4j, a Node-RED node that lets you run generic cypher queries on a Neo4j graph database. Node-RED is a programming tool for wiring together Internet of Things devices in new and interesting ways.

Next Week


What’s happening next week in the world of graph databases?

Date Title Group Speaker

May 3rd 2018

Thinking = Connecting. Text Network Visualization — Tagcloud 2.0

Neo4j Online Meetup

Dmitry Paranyushkin

Tweet of the Week


My favourite tweet this week was by Aaron Lelevier:

Don’t forget to RT if you liked it too.

That’s all for this week. Have a great weekend!

Cheers, Mark

Viewing all 195 articles
Browse latest View live


Latest Images